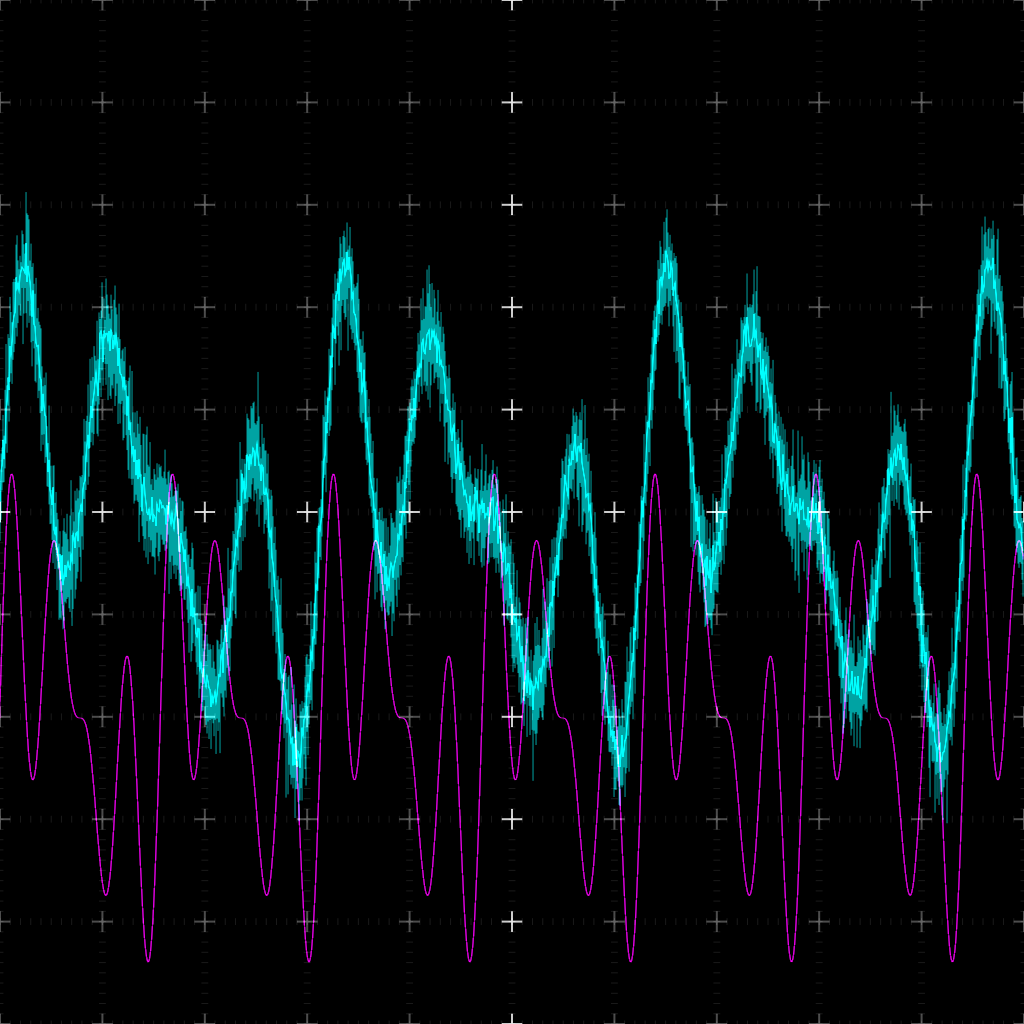
The main feature is that when a trace has more than one sample per horizontal pixel it goes into a sort of "envelope" mode, with a fainter trace showing the min and max and the bright trace following the median (not mean) value.
The demo writes out 3 static pngs, then shows a window that you can re-size to get an idea of the responsiveness. I have only run on a very beefy machine so far, which gives the impression that all is well. Resizing is tolerable, and exposing (and, by analogy, scrolling, when I get around to it) is pretty responsive.
Files currently attached to this page:
| demo.py | 7.0kB |
Entry first conceived on 15 August 2008, 2:59 UTC, last modified on 15 January 2012, 3:46 UTC
Website Copyright © 2004-2024 Jeff Epler